
The last few months have been unusual. COVID-19 has led to changes in our commutes, business operations, and home use patterns. It’s also changed how, when, and how much electricity we use. As long as we have social-distancing, efforts to re-open, and concerns about a second wave, forecasting electric demand will be more difficult. There are several fundamental questions:
• By how much has electric demand dropped?
• Are different parts of the U.S. affected differently?
• Is electricity demand rebounding to pre pre-COVID 19 levels? If so, where and how quickly?
• How will demand rebound over the summer, when most electric systems peak?
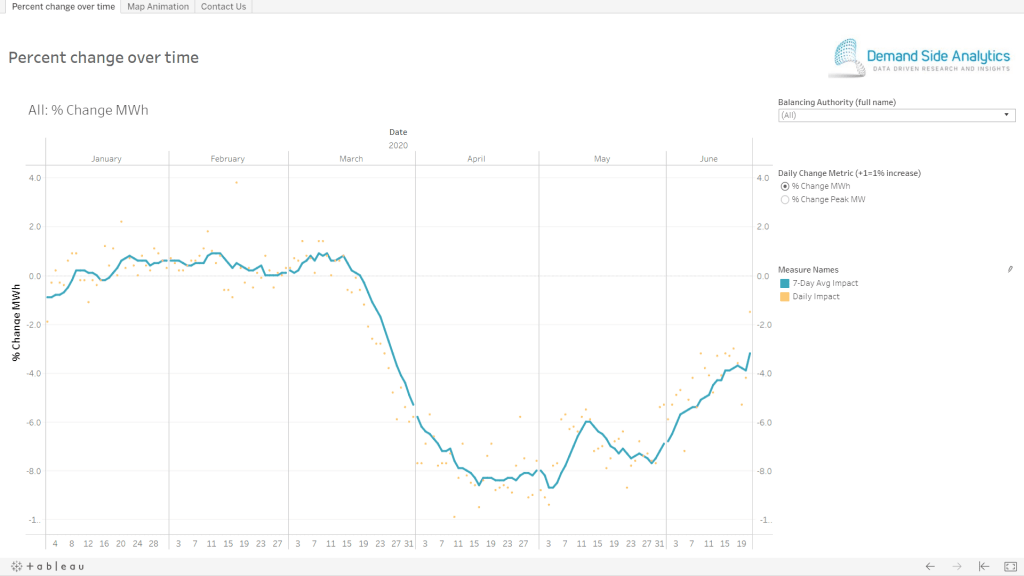
We were curious ourselves and decided to answer those questions. In the process, we built a live dashboard to track the effect of COVID on electric demand across the U.S. The plot above shows how electric demand changed over time compared to pre-COVID levels. The dots are individual days; the line shows the 7-day trend. In the U.S., electricity peak demand and sales dropped by roughly 7.5%. The drop is most noticeable in mid-March when the first stay-home orders started going into effect. Starting in May and June (depending on location), electricity use has begun to inch back up.
Our live dashboard also shows the effects by geography. Electric demand dropped off throughout the U.S. For some areas, such as Nevada and Texas, efforts to re-open the economy (and casinos) are clearly evident in the energy patterns.
So, where do we go from here? Our dashboard will be updated daily to track how electricity demand and use changes as we attempt to return to normal. Monitoring the effect of COVID on electric demand is the first step, however. COVID-19 has made forecasting energy sales and peak demand more difficult, both in the near and long term. The next step is developing short and long term forecasts that adjust as social distancing and re-opening of economies evolve. We have some ideas about how to do that.
For more information contact: