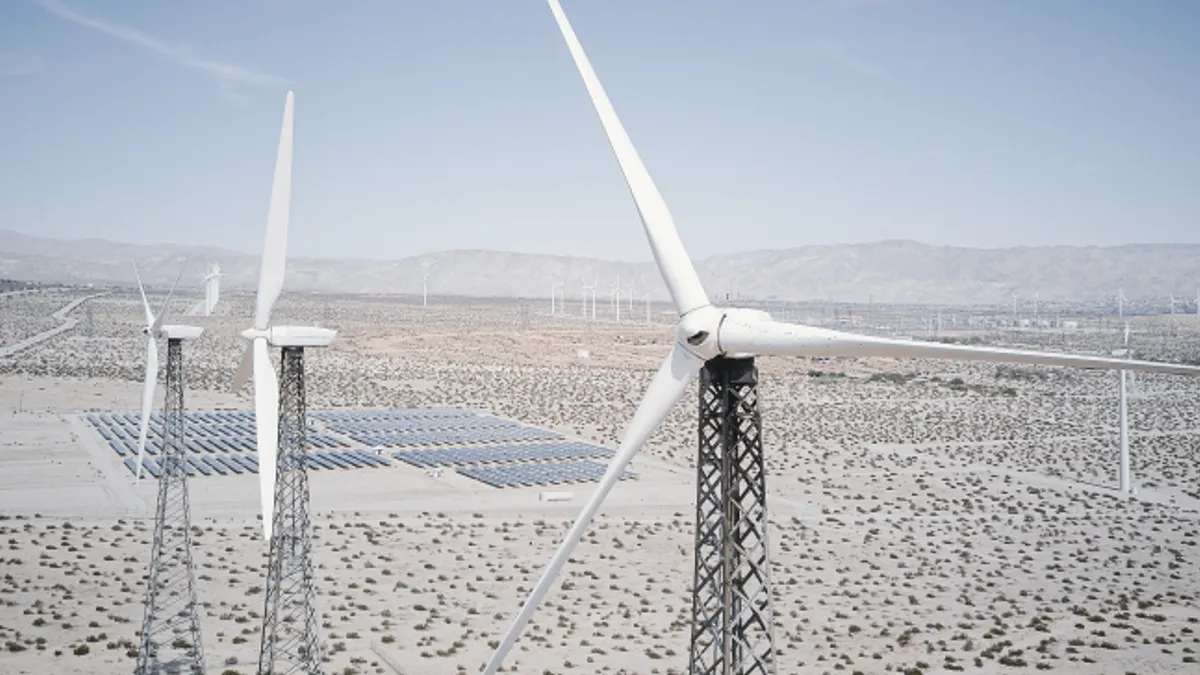
The rapid adoption of variable renewable energy resources such as solar PV and wind has expanded production capacities but raises concerns for resource adequacy for the transmission and distribution system operators. In California, this results in the 'duck curve' characterized by low net demand in the middle of the day, followed by a massive ramp to the evening peak demand. This is visualized in Figure 1a, where between 3:00 PM and 6:00 PM, solar energy goes off-line, and therefore, a massive 18.4GW spike in demand can be observed. Unfortunately, these spikes are only increasing in magnitude over time, as observed in Figure 1b, where 2021 had the largest ramp spikes.


These large spikes are challenging to the system operator since traditional baseload generation plants can't ramp at such a high rate. The result is the dispatch of expensive and polluting energy sources such as natural gas peaker power plants to ensure resource adequacy. Over the years, different technologies have been proposed to resolve this issue, including controllable loads to fill the valley and energy storage to store solar in the middle of the day to be used in the evening, flattening the overall curve.
Storage has been the most popular solution, and as of February 2022, the California Independent System Operator (CAISO) had 3.5 GWs of storage available for use. However, this storage is exclusively in the form of chemical battery storage (1.38GW) and hydro potential storage (2.09GW). 1 The challenge with these types of storage is that they are either low in energy density or not available in large quantities. They require a large footprint, and to avoid burdening the transmission and distributions system should be decentralized, e.g., in the form of Microgrids.
Hydrogen storage has become a popular alternative method of discussion, whereby energy (preferably renewable, referred to as green hydrogen) is used to drive the electrolysis of water into hydrogen, which is then stored and eventually used in a (hydrogen) fuel cell or reciprocal engine to create electricity. Hydrogen storage overcomes the limitations of the other types of storage by having an incredible energy density (175x higher than li-ion storage). Furthermore, it is entirely decentralized because hydrogen produced at one site can be piped anywhere with low losses and no added congestion to the electric grid. However, naysayers are quick to shoot down this concept, pointing to the low efficiency of the three-step conversion process (typically around 40% efficiency) and the high cost associated with purchasing all the needed equipment (electrolyzer, hydrogen storage, and a fuel cell or hydrogen-powered reciprocal engine). As a result, hydrogen storage for electric grid applications has yet to take off en-masse.
However, there are already conditions in which this approach can be used today to benefit the grid and the hydrogen producer. We have found that the interplay between hydrogen production facilities with excess hydrogen production capacity and owners of traditional generation who can cost-effectively retrofit their systems to run on cheaper hydrogen provides a net benefit to both parties while improving the operation of the bulk grid.
To model the interplay between the different available technologies (e.g., hydrogen, renewables, chemical batteries, etc.), a holistic modelling approach is needed to identify the best and cheapest technology mix. XENDEE, the cutting-edge Microgrid design platform, has incorporated years of research and experience working at the intersection of hydrogen and electrical systems into a design framework to make these decisions accurately and efficiently. XENDEE's decision support system built on top of an optimization engine considers the full spectrum of value stacking (e.g., ancillary services markets, among others) required to make these complex systems pencil out. XENDEE combines economic decision-making with power flow and distribution system modelling, making it a unique platform to provide the needed modelling for complex Microgrid and community projects. Modelling of long-term effects and how changes in technology costs, markets, performance, and tariffs will impact the system revenue streams is also important. This rapid multi-year optimization is unique to XENDEE and allows modelling of technology upgrades or changes over time.

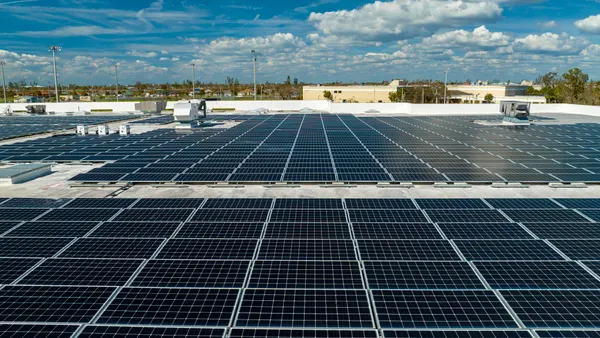
A recent project performed in XENDEE examined how a proposed hydrogen production facility for industrial usage and hydrogen cars using electrolysis in the California desert could economically oversize solar PV to improve the operation and reduce the impact on the utility system. XENDEE found that while some solar PV could improve the facility's operation, significantly more benefit came when the solar was vastly oversized and combined with a large amount of hydrogen storage. This combination allows the facility to overproduce and store hydrogen, which could significantly reduce the amount of imported electricity to fulfill the hydrogen production demands. The lowest cost operation came from leveraging low wholesale market electricity prices in the morning and late evening and the on-site solar generation in the middle of the day.
When examining the purchase of fuel cells to take advantage of this production capacity, the model consistently showed that fuel cells are still currently too expensive, despite the facility producing hydrogen at costs comparable with natural gas rates. However, when investigating how an existing generation asset (i.e., removing the required capital expenditure) would work, we found that the facility could again increase the revenue by further oversizing assets to provide hydrogen to that generator to produce electricity and sell it to the wholesale market during peak times.
The net benefit is an improved bottom line for the hydrogen production facility, lower operating costs for the owner of the hydrogen-burning generator, and a nodal market demand curve which flattens out the purchases coming through the node by increasing demand when it is traditionally low in the late evening/early morning, reducing the midday dip, and shaving the evening peak.


In this example, we discussed a special case for hydrogen implementation that naturally came out of our modelling process; however, we believe there is more to be discovered, especially as hydrogen production and conversion improvements continue to proliferate. Alongside these improvements, modelling tools like XENDEE can analyze the new technologies and the market to effectively determine the best technology mix and investment timeline to diminish peak usage burdens for operators and deliver the best returns to stakeholders.
1 This is true for most independent system operators (ISO) in the United States, where the New York (NYISO), New England (NEISO), Pennsylvania/New Jersey/Maryland (PJM), and Midwestern (MISO) have negligible battery storage but 1.25GW, 1.8 GW, 5.1 GW and 2.5 GW of hydro potential storage, respectively.


