Largely seen as fringe technologies just a decade ago, clean energy resources are becoming truly mainstream in the United States.
About 70% of the new generating capacity installed in the U.S. in the first six months of 2015 was renewable energy — largely wind and solar — and major states are confident enough in the resources to plan their energy futures around them. California and now New York are both aiming for 50% renewables by 2030, while Hawaii wants to get to 100% renewable energy by 2045. Dozens of other states either have renewable energy mandates or are considering them.
Technological advances and cost declines in a variety of clean energy resources are facilitating this shift toward clean energy. Earlier this month, the Department of Energy released a new assessment of five key clean energy technologies, outlining their price drops and deployment patterns over the past few years.
The paper, “Revolution… Now,” is a report card on the state of the clean energy revolution in the U.S., outlining an industry that is maturing into a major player in the power sector in terms of generation capacity and financial clout.
Here are 12 charts that show the state of the clean energy revolution underway in the U.S. right now:
Land-based wind power
Wind power, the DOE notes in a blog post accompanying the report’s release, has been around for at least 35 years, but really only started to catch on around the year 2000, when cost declines began to make it a viable generation source for utilities.
Since then, the growth in wind has been impressive. Between 2008 and 2014, the report notes, wind power accounted for 31% of all new generation capacity added in the U.S. Today, wind accounts for 4.4% of total generation capacity in the nation, but it is growing rapidly and poised to overtake hydropower as the most abundant renewable resource in the U.S. By 2050, DOE estimates that wind could account for 35% of total generating capacity, which would likely make it the single biggest generation resource in the U.S.
Driving that growth has been a steep and steady decline in the price of wind energy over the last decade. While rates were around $0.07/kWh for wind energy in 2009, the DOE reports that they fell to an average of $0.024/kWh in 2014, beating out most natural gas. Part of that decline comes from the federal production tax credit — worth about $0.023/kWh — but advances in turbine technology and higher capacity factors from improved grid integration have cut prices as well.
Looking ahead, DOE expects taller turbines to unlock more generation potential for individual turbines and open up entire new regions, like the Southeast, to wind development. Already this appears to be materializing.
Earlier this month, MidAmerican Energy announced plans to test what it says will be the world’s tallest wind turbine tower, a concrete structure that will stand 377 feet tall, more than 100 feet taller than traditional towers. At that height, turbines can access stronger, steadier winds, boosting their capacity factors and value proposition to utilities.
Utility-scale solar
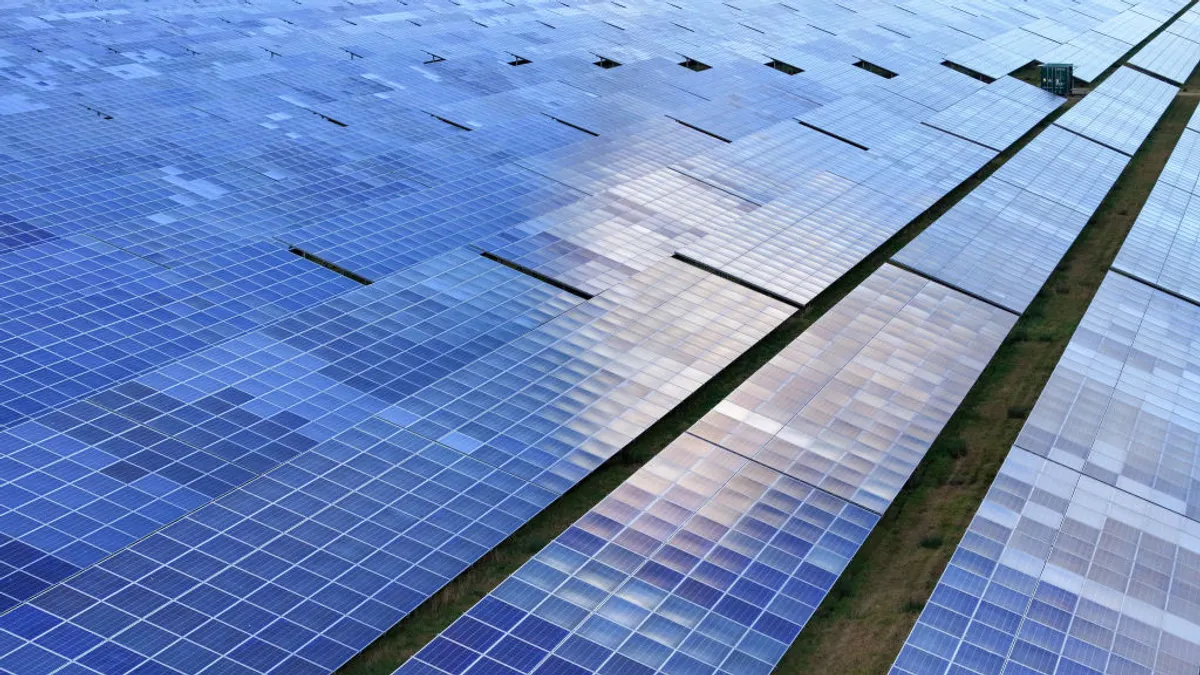
In terms of generating capacity, solar is still wind’s little brother, with less than a sixth of its total installed capacity. But it is utility-scale solar’s meteoric rise — from virtually nothing in 2008 to nearly 10 GW of capacity today — that makes it “one of the biggest clean energy stories of the past decade.”
Since 2008, the report notes, the cost of installing utility-scale PV has dropped from $5.70/watt to only $2.34/watt in 2014 — a nearly 60% reduction. And recent reductions in soft costs have allowed the price to drop even further this year, even though module prices remain flat.
The cheapest electricity reportedly available in America today comes from a utility-scale solar farm providing power for Austin Energy in Texas, while analysts say the price declines aren’t simply from one-off deals.
This year and last, the report notes, several utilities signed PPAs with solar developers for between $0.04/kWh and $0.05/kWh, choosing solar over more traditional sources of generation.
“These are not just simple one-off projects with unusually good economics; utilities have on multiple occasions received proposed projects in this price range with aggregate capacity of more than 10 times the capacity requested,” the report notes.
DOE analysts expect utility-scale PV to grow significantly in the coming years. 27 GW of projects are currently in development, and the Obama administration’s Clean Power Plan, along with state renewables mandates, is expected to drive growth in the medium term. Pairing large solar facilities with energy storage, such as the groundbreaking dispatchable solar project in Hawaii, could help solar grow even further by allowing its generation to be dispatched when it is most needed.
Distributed solar
Distributed solar, usually deployed on customers' rooftops, remains more expensive than its utility-scale counterpart, but has followed largely the same price and deployment trajectories.
Beginning from nearly nothing in 2008, rooftop solar deployments have skyrocketed to nearly 10 GW of capacity nationwide. The average price for distributed PV has dropped from close to $9/watt in 2008 to just over $4/watt in 2014, and prices are expected to continue declining as installers continue to find efficiencies and cut soft costs.
More important than distributed solar’s capacity, however, is how its rapid proliferation has spurred change in the electric utility sector. As utility customers install their own generation in increasing numbers, utility companies have had to change the way they operate the grid, moving from a centralized, one-way delivery system to one that accommodates bi-directional power flows. And since DG customers typically pay less on their electricity bill, utilities have grappled with how to properly value distributed solar generation without shifting costs to non-solar customers. Those debates, some of the most contentious in the sector, are still ongoing nationwide.
Looking ahead, the value proposition for distributed solar will be transformed by cost-effective energy storage. If and when home batteries become cheap enough for mainstream adoption, customers will be able to use them to store excess solar energy generated during the day, using it to power their homes during peak hours when electricity is most expensive. This concept, called “demand flexibility,” could drive the sector toward a more distributed grid in the future.
LED lighting and efficiency
Keeping with the trend set by solar, LED lights were barely in use at all in 2008, but have skyrocketed in the years since. There are now nearly 80 million LED bulbs deployed in America today, each using 85% less electricity than traditional incandescent bulbs.
Costs for LED bulbs have dropped by almost 90% in those years — a consequence, DOE writes, of government-industry investment in research and development.
While the trends in LED deployment are impressive, they are really just an illustration of economy-wide trends in energy efficiency over the last few years. Since the financial crisis and recession, the entire American economy has become less energy-intensive and GDP growth has begun to decouple from growth in energy and electricity consumption. Over the next few decades, the EIA expects electricity growth to lag behind overall economic growth — growing only 0.9% annually through 2040. That number may drop even further due to the increased importance of energy efficiency for utilities and states attempting to comply with the Obama administration’s Clean Power Plan, which was finalized after the EIA estimates were published last year.
Electric vehicles and energy storage
While the adoption of electric vehicles hasn’t been as fast as many clean energy advocates would like, DOE reports Americans bought nearly 120,000 EVs in 2014, more than double the number purchased only two years before.
There are now nearly 300,000 electric vehicles on the road in the U.S. Although that comprises a small fraction of the more than 250 million cars in the country, DOE expects that to change. Battery prices have come down steeply in recent years, making electric cars more affordable and driving the revolution in stationary energy storage today. While EV batteries were about $1,000/kWh in just 2009, costs fell to about $300/kWh in 2014 and the trend is expected to continue. Tesla, which pioneered much of the storage revolution with its pathbreaking car line and battery products, is aiming to drive prices to the $100/kWh range by the end of this decade.
As electric cars proliferate, utilities are studying how to use them for grid support functions. By adjusting charging settings or drawing from EV batteries on the grid, utilities can help integrate renewables or shave load during peak hours, and 2015 has seen a slew of pilot projects announced around the nation to test vehicle-grid integration.
Perhaps more important, however, is the growth of stationary energy storage, both behind the meter at customer sites and at the larger grid scale. While adoption of stationary storage is still in its early stages, the utility sector is very bullish on the technology, and some utility leaders are looking ahead to a day when batteries can help eliminate the need for fossil fuels on the grid.
The impacts of the clean energy revolution
Taken together, the price declines in each of the clean energy technologies follow each other quite closely, indicative of an overall trend in these technologies becoming dramatically cheaper over the last decade.
Those advances, along with the economic recession and new energy policies, have helped to start reducing carbon emissions from the American power sector. Earlier this month, the Sierra Club found that power sector emissions are projected this year to drop to their lowest levels since 1995:
Much of the decline in emissions has been fueled by coal plant retirements. Driven by the low price of natural gas and the Obama administration’s clean air regulations, Sierra Club identified nearly 42 GW of coal generation retired between 2010 and today. The group expects an additional 53 GW to come offline by 2030.
Much of that retiring coal generation has been replaced with natural gas combined cycle plants, which emit only about 60% of the carbon emissions of traditional coal facilities. But while the plants are cleaner-burning, the increased reliance on gas worries many environmentalists.
Methane is a greenhouse gas 86 times more potent than carbon dioxide, and scientists largely agree that no more than 3% of the natural gas that gets produced can leak into the atmosphere during drilling or transportation to see the climactic benefits of gas over dirtier technologies.
Currently, the EPA estimates that 1.8% of methane produced in the U.S. escapes into the atmosphere, but recent studies have shown methane leakage in some systems to be nearly four times that amount. Utilities and cities can make a big difference in reducing leaks by taking proactive steps to upgrade aging pipeline infrastructure:
The endgame: Decarbonization
The clean energy revolution chronicled in DOE’s report is impressive, but it pays to remember that the utility sector and others will have to step up decarbonization to achieve the climate goals laid out by the Obama administration.
While the 32% reduction in carbon emissions by 2030 envisioned under the Clean Power Plan is within reach, recent modeling from the think tank Energy Innovation shows that it will take a more aggressive, cross-sector approach to get to the bilateral emissions goals Obama set with China last year. In those talks, the president committed the U.S. to reduce its emissions 26-28% by 2025.
Those greenhouse goals may soon change, however, as the world’s nations commune next week in Paris to hammer out an international deal to fight climate change. While most analysts don’t expect the countries to sign an agreement that will keep warming below 2 degrees Centigrade, the internationally-accepted goal to stave off climate change, they hope to find framework to use to bring down emissions further in the future.


