Dive Brief:
- Solar developers installed 26.5 GW last year, down 22% from the 33.8 GW they installed in 2024, according to the Federal Energy Regulatory Commission.
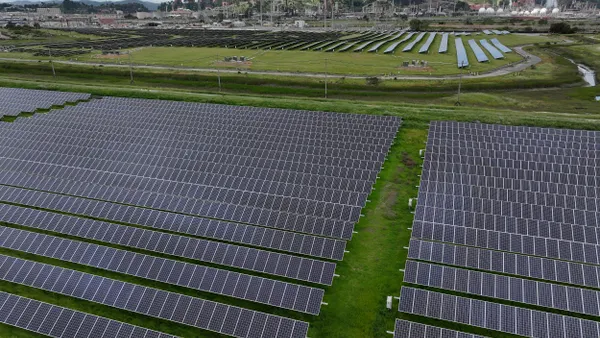
- Despite this decrease, solar still led all other generation sources in 2025 installations. As of December, solar now makes up 12.2% of installed generating capacity in the U.S., according to FERC — trailing only natural gas, at 42.2%, and coal, at 14.3%.
- In 2025, the U.S. solar industry “navigated unprecedented change, ranging from numerous trade actions to the reversal of renewable energy tax credit policy,” the Solar Energy Industries Association said in a March 9 report. “Many projects stayed on track, but the market and policy uncertainty took a toll, leading to project delays and cancellations across all segments.”
Dive Insight:
The decline in solar installations took place despite the ongoing rush to bring projects online in order to qualify for the Inflation Reduction Act tax credits, which had their timelines curtailed by the One Big Beautiful Bill Act.
SEIA noted that in the first three quarters of 2025, solar installations remained largely the same year over year, “but in the fourth quarter, volumes fell by nearly 40% year-over-year. By the end of 2025, installations totaled just under 35 GW as many utility-scale projects were delayed into 2026 and 2027.”
“As developers shifted their focus towards safe harbor strategies, there was less urgency to bring late-stage projects online by year end,” SEIA said. “This weakened fourth quarter deployment but created a more robust near-term pipeline for 2026 and 2027.”
FERC’s data shows that natural gas added fewer units in 2025 — 84, compared with to 122 the previous year — despite a 1.5 GW increase in installed capacity. Wind capacity also grew as developers added 5.7 GW in 2025 compared with 4.5 GW the previous year. No new nuclear capacity came online in 2025. U.S. nuclear capacity increased 1.1 GW in 2024, when Plant Vogtle Unit 4 came online in April that year.