Kai Karlstrom is director of solutions engineering for Repath.
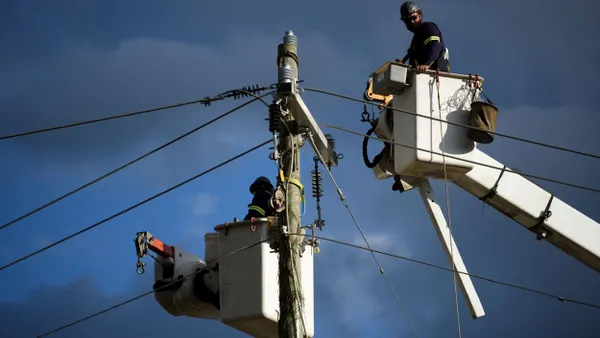
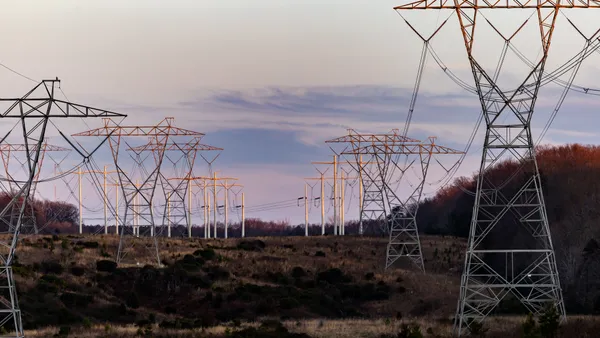
When we talk about physical climate risk in the utility sector, we almost exclusively picture the catastrophe as a category 5 hurricane snapping transmission towers, or an unprecedented freeze shutting down the grid. These events are tragic, visible and mobilize immediate regulatory support.
But while we prepare for the 1-in-100-year event, we’re bleeding cash on the 1-in-5-year reality.
Most utilities are currently mispricing physical risk because existing reliability models often treat weather as a static baseline. They assume that the "average" day in 2030 will look like the average day in 2000. It won't.
As heat and precipitation baselines shift, they create a "silent derating" of grid assets — eroding efficiency, increasing fault rates and driving up operating expenditures long before a named storm ever makes landfall.
We recently analyzed an approximately $1.5 billion grid portfolio in Europe comprised of 37,000 miles of overhead lines and 13 critical substations to quantify this financial impact. The data was stark: Under a "business as usual" climate scenario (RCP 8.5), climate hazards threaten to erode 30.57% of the portfolio’s gross value by 2050.
This value destruction doesn't happen all at once. It happens incrementally, accumulating as average annual loss, or AAL. Unlike a singular major event, AAL captures the steady financial drip of efficiency losses and minor outage repairs that fly under the radar until they impact the bottom line.
All emissions scenarios lead to higher costs
One of the most critical insights for utility planners is the divergence (or lack thereof) between climate scenarios. Often, utilities delay resilience investments hoping that global mitigation efforts will reduce the need for local hardening. Our analysis suggests this is a dangerous gamble.
In the analyzed portfolio, while the "business as usual" path leads to a ~30% value erosion, even the "climate protection" scenario (RCP 2.6) still results in a 21.54% value risk by 2050. The gap between these scenarios indicates the financial benefit of climate protection, but it also proves that significant physical risk is already baked into the system.
Whether we follow a high-emissions or low-emissions trajectory, the hazards arrive, differing primarily in their steepness and timing. For instance, operational expenditure losses under “business as usual” climb noticeably faster after the 2040s, mirroring increased interruptions and emergency maintenance. However, under both scenarios, the trajectory is upward. Waiting for global policy to solve local grid reliability is not a viable strategy; the "climate tax" is coming regardless of the emissions pathway.
The silent derating of the grid
The most dangerous risks are the ones current models don’t flag. Standard asset management often focuses on age-related degradation, but climate stress accelerates this aging.
Our analysis found that unadapted overhead lines were uniquely vulnerable. Heavy precipitation acts as a key trigger for outages, with chronic stresses like wind and heat modulating baseline fault rates across seasons. In our portfolio analysis, gross revenue losses driven by these hazards were projected to climb over 12,000% by 2050 compared to today’s baseline under a high-emissions scenario.
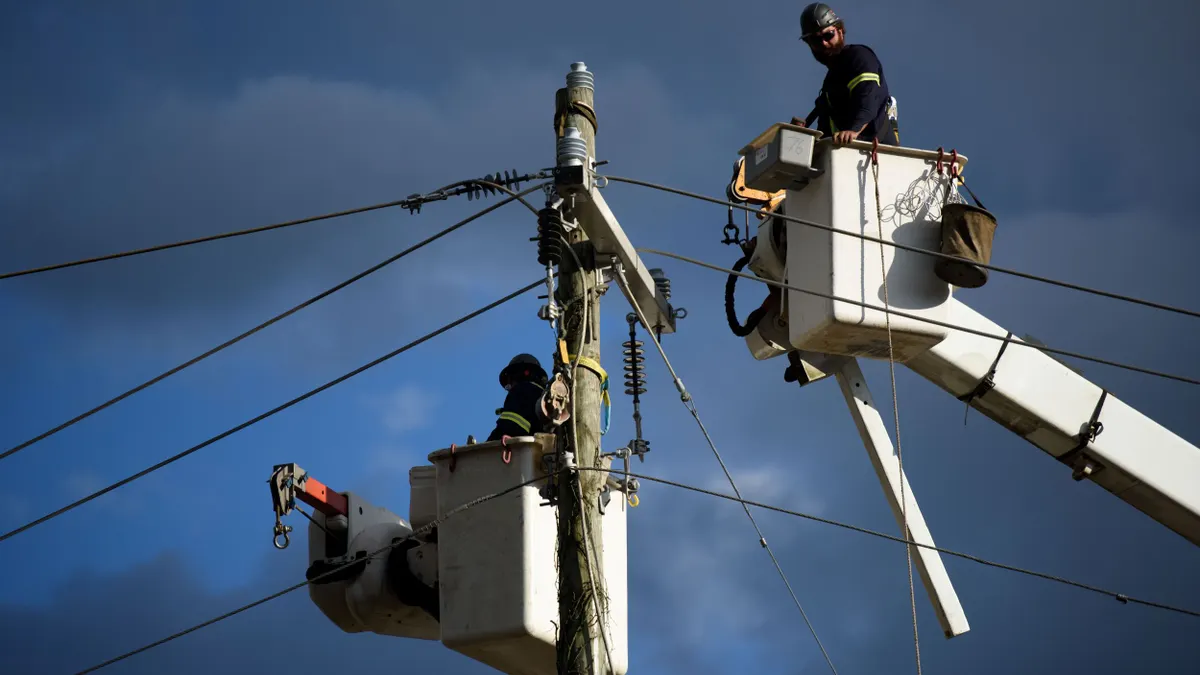
This isn't so much a storm problem as it is a conditions problem. For this operator, damp, heavy air increases vegetation contact and conductor clashes. While overhead lines drive the majority of operational loss through fault frequency and restoration time, substations bear the concentrated risk of catastrophic damage from flood inundation. If a utility’s rate case assumes historical fault averages rather than projected AAL, it is under-collecting on the true cost of future reliability.
The ROI of resilience
The good news is that unlike vague "climate mitigation" goals, adaptation has a calculated, defensible return on investment. When we move from generic "exposure heatmaps" to calculating the reductions in AAL, we can identify exactly when a resilience measure pays for itself.
However, utilities cannot simply harden everything. The capital constraints require a prioritization framework. In our study, we mapped adaptation measures on a scatter plot comparing implementation cost against technical benefit (reduction of faults). This revealed two distinct categories of investment that utilities should prioritize:
The "no regret" move: hardening overhead lines
For medium-voltage (15 kV) lines exposed to heavy precipitation, the fix is often converting bare conductors to semi-insulated compact conductors (AAC 95 mm²) or aerial bundled cables (ABC). This is not a massive engineering overhaul; it’s a targeted upgrade. In our analysis, specific "no regret" feeder segments showed a financial breakeven between year three and year five. The payback comes not from surviving a hurricane, but from the daily reduction in transient faults and the avoided penalties of energy not supplied.
The defensive asset: flood-proofing substations
Substations are capital-intensive nodes where risk is concentrated. Our modeling of specific substations exposed to 1-1.6 foot flood depths showed that relatively simple interventions such as raising foundations or installing deployable barriers cost between about $180,000 to $1.4 million (€150,000 to €1.2 million). Crucially, these investments showed a breakeven point around year six. By quantifying the AAL avoided by preventing these floods, we prove that these measures turn physical protection into a defensive financial asset.
Data-driven defense
The era of treating climate adaptation as a "nice-to-have" or a "storm surcharge" is ending. Regulators and investors are beginning to demand granular proof that capital plans are robust against future weather baselines.
For utilities, the path forward is to stop viewing resilience as a cost center. By quantifying the AAL on their portfolios, specifically the operational expenditure drag of silent derating and the capital expenditure risk of flash floods, they can build a rate case that is financially defensive and operationally prudent.
We have the technology to calculate the payback period of a thicker cable or a higher flood wall. It's time we started using it to justify a stronger, smarter grid.