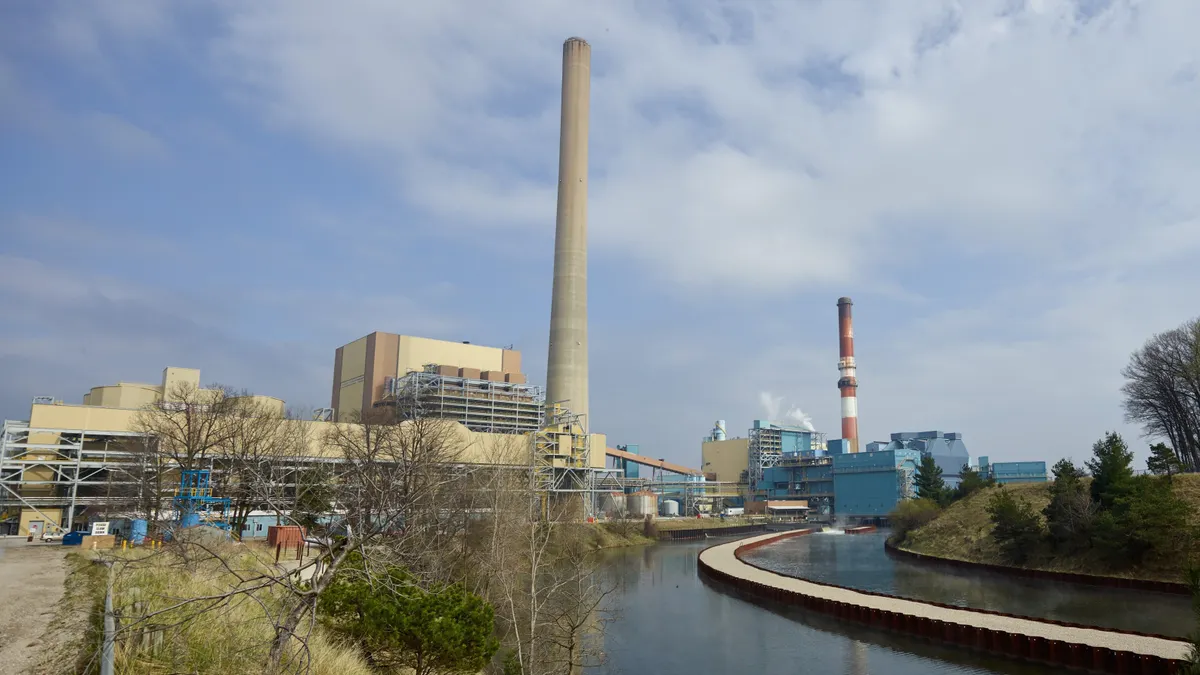
Natural gas is the new leader in the electric power mix. After nearly edging coal out of the top spot last year, the EIA expects gas will generate more electricity than any other fuel source in 2016, accounting for about a third of the nation's power.
But even while natural gas takes the number one spot, there's a growing realization among utilities in some regions of the country that it may not be the best bet on cost over the long term.
While gas prices are near historic lows today, few analysts believe they will stay that way forever. And with a growing global consensus around climate action, many companies expect further regulations on fossil fuels sometime in the future.
Set against those doubts is a period of relative stability for large-scale renewable energy, particularly wind. Late last year, the federal government extended the $23/MWh production tax credit (PTC) for wind, a move Bloomberg estimates will contribute 19 GW of additional capacity deployments over five years. Costs are coming down sharply as well — the industry says it has cut installed costs 66% since 2009, and expects them to keep falling.
All that has made new investments in wind energy particularly appealing to many utilities, especially those in the center of the country, like Xcel Energy.
“The production tax credit coming and going has made wind in-the-money and out-of-the-money at different times over the last 15 years,” Xcel Energy Colorado President David Eves told Utility Dive. “With the full $23/MWh PTC, wind produces energy at below the cost of a combined cycle turbine with the forward gas curve we see. That is in-the-money.”
"Whether it is a power purchase agreement or a utility-owned wind project, it will have a much more stable and predictable cost of energy than fuels like natural gas that have been more volatile in price,” Eves said.
The Xcel Colorado president should know. The 6,545 MW of wind capacity on Xcel Energy’s system at the end of 2015 was, for the eighth consecutive year, the most of any U.S. utility, according to the just-released 2015 U.S. Wind Industry Annual Market Report from the American Wind Energy Association (AWEA).
Xcel was also the eighth biggest holder of new wind capacity last year with 350 MW, the report adds.
Warren Buffett apparently got the word on wind, too. His Berkshire Hathaway Energy (BHE) has 5,525 MW it its portfolio, ranking it second in total system wind, and its 4,375 MW of owned capacity makes it first in direct wind ownership.
Last year, BHE added the 502 MW Highland Wind Project, one of the ten biggest in the U.S. and the biggest wind project ever built in one phase.
It's not just large investor-owned utilities getting in on the good times for wind. Municipal utilities, electric co-ops, and a growing number of non-utility customers are taking advantage, painting a rosy picture for the industry in years to come.
The state of the wind industry
The extension of the PTC capped a productive 2015 for the wind industry. With companies expecting the incentives to sunset before lawmakers acted, many had rushed to put steel in the ground to take advantage of the tax credits.
Wind energy provided 4.7% of U.S. electricity in 2015, the most of any non-hydro renewable resource, according to the Energy Information Association. Renewables met 13.7% of the nation’s electricity demand, with hydro leading at 6%.
Wind topped the list of new capacity for 2015, according to a separate estimate from FERC, providing 41%. Solar was second, with 28.5%, and natural gas was third, with 28.1%.
The U.S. wind industry installed 4,304 turbines and 8,598 MW of new capacity across 20 states in 2015, an annual growth rate of 12.3%. This brought wind’s cumulative capacity to over 48,500 turbines and 73,992 MW, according to the AWEA report. It was the industry’s third biggest year ever, a 77% increase over 2014’s 4,854 MW added and almost seven times more than 2013’s 1,087 MW.
The 191 million MWh of wind generation in the United States last year led the world, the report added. U.S. wind's almost 7.4 GW of installed capacity is 6.6% of the country's 1,127,218 MW electric generating capacity.
The growth in wind deployment was evidenced by state and grid operator generation mixes, especially in the center of the country. Iowa got over 30% of its electricity from wind last year, and South Dakota got over 25%, Texas got more than 10% from wind, and 20 states now get 5% or more. Every large U.S. grid system operator set a record for wind generation and/or wind penetration in 2015, AWEA reports.
There was over 9,400 MW of potential capacity in construction across 72 projects in 22 states and Guam at the end of the year and over 6,600 MW of it began construction in 2015, AWEA added. That included construction of Deepwater Wind’s Block Island Wind Project off the coast of Rhode Island, the first U.S. offshore wind installation, expected to be online by the end of 2016.
The wind sector added over 15,000 full-time equivalent jobs in 2015, bringing its total to an all-time high of 88,000 jobs in construction, manufacturing, and operations, according to AWEA. The U.S. Department of Labor (DOL) recently named wind technician the fastest growing profession in the country and reported it is expected to increase by 108% over the next ten years — over twice the rate of the second-fastest growing job.
The industry attracted $14.7 billion in wind project investment in 2015, up 73% from 2014’s $8.5 billion, accordin to the report. It delivered $222 million in annual land lease payments to rural farmers and landowners. Over $156 million of that went to low-income counties.
Utilities are buying
More than 60% of wind capacity now deployed in the United States was procured through a PPA with an independent power producer (IPP), according to the AWEA report, with smaller amounts coming from direct utility ownership and merchant wind generation.
Of the PPAs with an IPP, more than 78% since 2013 have gone to the nearly 3,300 electrictity providers across the nation.
There are three key drivers behind the rising demand for wind from utilities, according to AWEA Senior Research Analyst Hannah Hunt. The first is wind’s falling installed cost.
“Utilities are increasingly aware wind is cost-effective and saves money for their customers," Hunt said, echoing Eves' comments.
The second is an increasing confidence about reliability.
“Utilities are seeing they can reliably integrate it into their system," Hunt said. "Generation records on grid operators’ systems and utilities’ systems are being broken over and over. In Colorado, Xcel Energy has seen wind penetrations over 65%.”
Somewhat ironically, the parallel growth in natural gas has assisted the reliability of wind energy, with modern, fast-ramping gas plants allowing utilities to smooth out variability in renewable generation.
The third factor, Hunt said, is utilities’ growing awareness of the need to comply with the Clean Power Plan.
“The EIA last year reported wind is the lowest cost option to add to a utility portfolio for compliance," she said.
Those three drivers have led to significant buy-in from across the utility sector.
At least 64 of the 192 investor-owned utilities (IOUs) in the U.S. own or have contracted for wind, according to the AWEA report. Of those, 18 have at least 500 MW of capacity on their systems, and eight have 1,000 MW or more. Behind Xcel and BHE in the top five for installed capacity are Southern California Edison (3,982 MW) American Electric Power (2,743 MW) and Pacific Gas and Electric (1,971 MW).
Direct utility ownership has accounted for only 15% of all wind capacity installed since 2009. After BHE in the ownership top five Puget Sound Energy (772 MW), Portland General Electric (717 MW), Xcel Energy (652 MW), and Alliant Energy (568 MW).
The nation's rural electric cooperatives are taking advantage of wind as well. More than 40 had owned or contracted for some 5,100 MW of wind capacity by the end of 2015, representing about 7% of the U.S. fleet.
Basin Electric Power is the leader in wind among co-ops. One of the biggest generation and transmission co-ops in the U.S., its 811 MW of owned and contracted wind capacity serve 2.8 million customers from the Canadian to Mexican borders. After Basin Electric in the top five were Associated Electric with 750 MW, Western Farmer’s Electric wth 485 MW, Great River Energy with 475 MW, and Minnkota Power with 359 MW.
Public utilities and public utility districts have procured a bit more wind than co-ops, with their combined 6,600 MW representing about 10% of U.S. wind capacity.
Austin Energy, the leading municipal utility in wind power, now has approximately 1,350 MW in its current portfolio and is considering a further 150 MW, according to Energy and Market Operations Director Pat Sweeney.
“Wind does serve as a partial hedge against fuel and power price volatility as well as environmental regulation,” he told Utility Dive.
Following Austin Energy in the top five are CPS Energy (1,059 MW) the Los Angeles Department of Water & Power (996 MW) the Omaha Public Power District (413 MW) and the Sacramento Municipal Utility District (387 MW).
Non-utilities are buying
U.S. utilities may be responsible for more than 70% of PPAs with independent producers since 2009, but last year more than half of them (2,074 MW) went to non-utility offtakers — up from 23% in 2014 and 5% in 2013.
The finding in the AWEA report reinforces the recent trend of private sector, non-profit, and governmental entities going after their own wind when their utilities do not provide it at competitive terms.
Over 70 non-utility offtakers have now contracted for over 4,500 MW of wind, according to the AWEA report.
“These Fortune 500 companies, universities, and municipalities want to meet sustainability and clean energy goals and lock in low-cost, fixed-price contracts,” Hunt said. “The demand is increasing because the contracts are cost-effective.”
“Energy users want choice in the source of their supply,” Xcel's Eves said of the increase in non-utility offtakers. “Customers want cleaner energy and utilities want to give it to them.”
Xcel’s Renewable*Connect program in Minnesota and its Solar*Connect program in Colorado, both awaiting regulatory approval, are new rate plans designed to meet the demands of non-utility offtakers for clean energy. The Minnesota plan includes wind.
Through the Connect programs, Xcel contracts for generation outside of what it uses for its broader system, Eves said. The customer pays for the renewable energy and for use of parts of the system, but gets a bill credit covering the fuel charge and a portion of the fixed infrastructure charges.
“The cost of the energy [in the program] could initially be slightly more expensive than retail electricity,” Eves acknowledged. But it is reasonable to assume that over the life of the ten year contract the customer would get savings and a hedge in the Connect programs’ long term fixed price, he added.
Persisting investment questions
Though natural gas will still play an important role in balancing variable renewables, its competitiveness against resources like wind could diminish further if cost declines continue and gas prices rise.
“You think about the choice between investing in natural gas or wind in two ways,” Eves said.
From a strategic financial perspective, investments that don’t cause rate increases and provide system benefits are the objective. “You don’t want to just grow the company and raise rates," he said.
From the customer perspective, the decision rests on what is most economic, he said, and currently the PTC and ITC extensions advantage renewables.
They are currently “in-the-money” and they offer fixed and foreseeable costs over the long term, Eves said. “It is good to have a significant component of the energy mix be more stable and predictable.”
The decision between a PPA and ownership of wind depends on “the resource acquisition process, the capital capacity of the utility, the alternatives in the market, and their prices,” Eves said.
In 2010, Xcel made over $4 billion in capital expenditures for fossil fuel and transmission infrastructure, making a wind contract more practical than an outright purchase of a facility. At a time when the utility has capital to invest, a purchase might be the right choice.
Beyond the question of how to get renewables onto a utility's system is which resource to contract for, Eves said. The choice between solar and wind depends on a range of factors, including “how their costs compare and how they shape the cost per customers,” Eves said.
Load profiles, portfolio diversification, expectations about curtailment, and the economics of the resource being displaced would also be part of his decision-making, he added.
Moving ahead with wind is probably the better decision right now because the PTC is at 100% of its $23/MWh value, Eves said. But it is not yet clear whether it will remain the better value when the credit phases down to 80% of its current value after this year, or when it drops to 60% after 2017.
“The solar ITC will be stable for the next few years and we know the cost of solar is forecast to decline,” Eves said. “So if I made the choice today, a wind project would have the advantage but solar might have the advantage after the PTC is reduced and while the ITC is still at 30%.”


