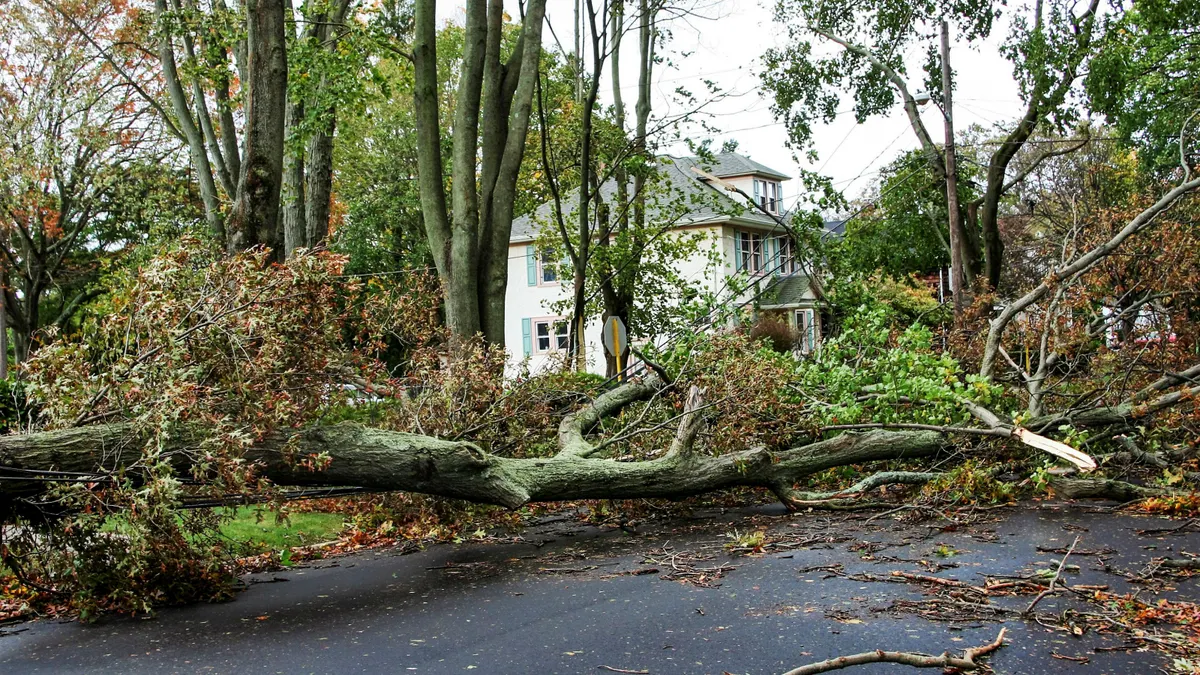

For many, fall means sweater weather and all things pumpkin spice. For utilities, these months have other, less festive sides. Hurricane season, wildfire season and the start of the heating season all converge in the same 8-12-week window.
Hurricane season may be quieter this year, thanks to El Niño, but data shows climate change has intensified Atlantic hurricanes. Meanwhile, fall is peak wildfire season, particularly in California, when Santa Ana winds kick up. And the northern half of the country is switching furnaces back on after months of inactivity. Individually, these are known risks utilities plan for. Layered together, they're a bigger threat.
Because of this, utilities are starting to ask more of their outage maps, moving beyond "when will my power be back on?" to "what's happening around me?" Maps are becoming less of a status tracker and more of a situational awareness tool.
The outage map levels up
For decades, utility outage maps told customers when their power would be back on, along with repair status and outage cause. That’s still valuable, but outages aren’t the only thing causing sleepless nights. Hazards now stack and planned maintenance often lands in the same week and region as storms, wildfires and seasonal gas-related risk.
Historically, customers pieced this information together from disconnected sources like text alerts, county web pages, weather apps and wildfire trackers. Now, hazard layers bring it together in one place, drawing on GIS, OMS and weather feeds.
This shift isn’t just about the growing frequency and overlap of hazards. It also reflects rising customer expectations for self-service, with the map as their first stop before the call center.
Self-service isn’t optional in a crisis
During a crisis, utility customers want access to whichever channel responds fastest and most clearly. If the utility’s map can’t deliver, their next stop is usually the already strained call center.
Utilities say they want the same thing. Chartwell's 2024 benchmark survey found that 77% named reducing call center and crew impacts as a strategic objective and 93% named satisfying customers as a strategic objective. The stakes are real. Annual call center cost is $20-40 million for a typical two-million-customer utility fielding two to three million calls a year.
What does this look like in practice? During a major winter storm, Rappahannock Electric Cooperative added richer hazard context to its outage map, adding outage polygons to outline affected areas and damage photos to explain long restoration times. The result: 500,000+ views in two days and an average session time of approximately 12 minutes, well above the global benchmark of 2.5 minutes. This shows customers used the map as a primary source, not a quick check-in.
It wasn’t an outlier. During a major multi-state storm, outage maps across affected utilities drew 9.78 million views in three days. Mobile traffic climbed from 75% to 86%, as customers checked and rechecked maps from their phones. Every customer who self-serves on the map is one less person tying up phone lines.
The equity gap
Visibility upgrades only matter if everyone can benefit. Language, disability and access barriers mean some customers still get left behind in a crisis. Addressing these challenges means making map information clear and in actionable language across all channels.
Text, email and voice reach different populations in different ways. During Hurricane Idalia, opt-in data to alerts showed just that: text and email led at 45.3% and 40.3%, respectively, with voice trailing at 14.4%, underscoring the value of offering multiple channels, delivered in language customers can actually act on.
Channel reach is only half the equation; plain language is the other. Most utilities are still catching up. Very few have fully simplified their messaging or removed jargon. The message needs to be clear to work.
Redefining what a good map does
Uptime and map refresh rates still matter, but next-gen outage maps will be judged on more than restoration times. As storms, wildfires and gas risks pile up alongside planned maintenance, utilities need to keep every customer informed, not just report on uptime. That means investing in multiple communication channels. As the Idalia data shows, each channel reaches a different slice of the customer base and no single channel is enough alone.
Treating hazard visibility, communication equity and channel diversity as one problem, not three, is what builds trust.