Dive Brief:
- An examination of energy price data from the last seven years doesn’t show a correlation between clean energy deployment and rising rates, though high renewable portfolio standards can cause increases, said a report the Clean Air Task Force released Tuesday.
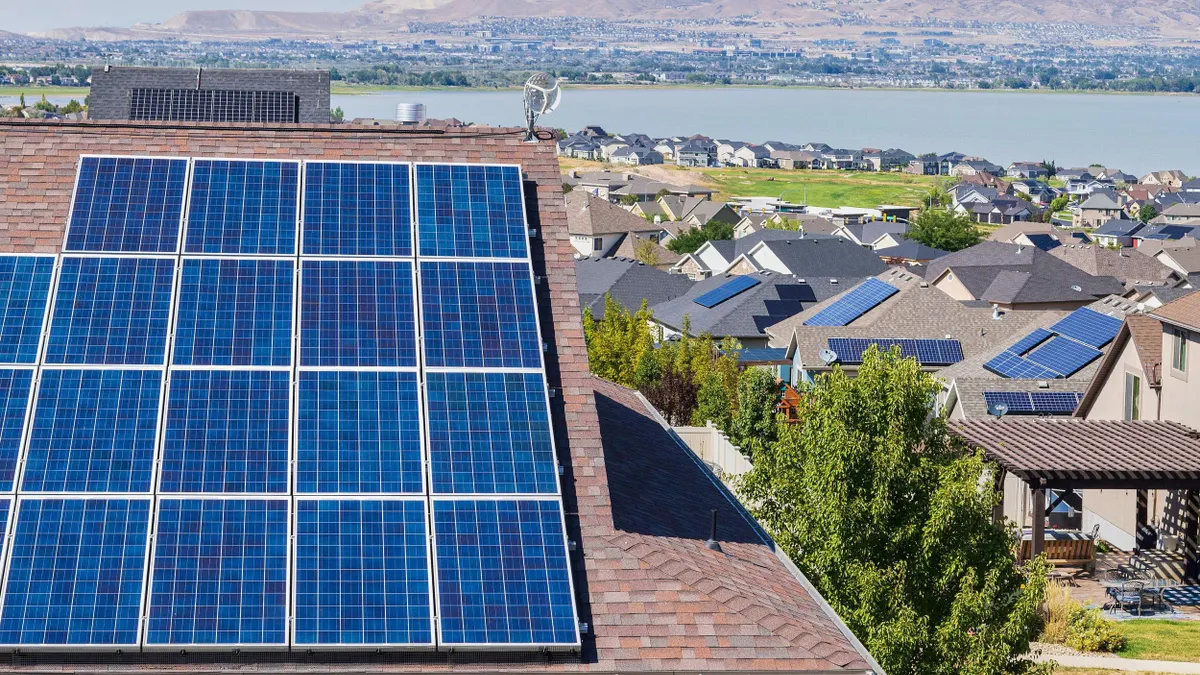
- The report primarily examined the findings of a December study published by researchers at the Lawrence Berkeley National Laboratory, who found that “states with the greatest price increases typically exhibited shrinking customer loads — partially linked to growth in net-metered behind-the-meter solar — and had [RPS] in concert with relatively costly incremental renewable energy supplies.”
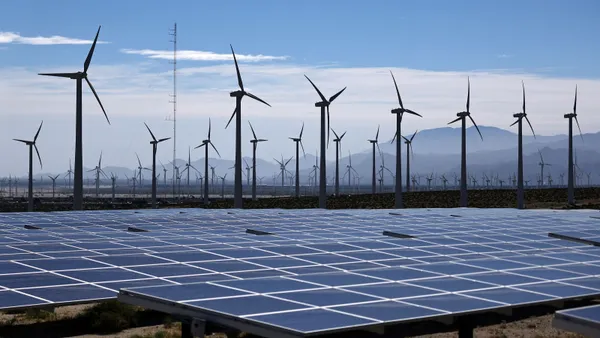
- In contrast, the LBNL study found recent utility-scale renewables deployments that occurred outside RPS programs, but that benefited from tax incentives, “had no discernible impact on increased retail prices.”
Dive Insight:
Rates have risen steadily over the last few years, with household energy arrearages rising by about 31% between December 2023 and June 2025. The U.S. Energy Information Administration forecasts the national average residential price per kilowatt hour in 2026 at 18 cents — around a 37% rise from 2020.
CATF’s report noted that states with the highest increase in renewable generation share from 2019 to 2024, like “Iowa, New Mexico, and South Dakota, have seen some of the largest decreases in electricity rates. … If anything is clear at this stage it is that clean electricity generation is not the culprit of cost increases.”
The LBNL study found that increased costs were associated with RPS growth requirements as the result of a mismatch between supply and demand. Growth requirements in a state are likely to “increase prices if RPS requires more renewable energy than would otherwise be delivered by market alone; no such effect if market would have delivered supply without RPS,” the study said.
The CATF report identified key factors impacting electricity rates, including: changes to the cost of infrastructure projects; slow interconnection; volatile fuel prices; extreme weather; cost of capital; rate design policy; and changes in electricity demand.
“Demand growth can increase the utilization rate of fixed infrastructure, such as distribution grids, and decrease per-unit prices for customers,” CATF said. “However, demand growth can also result in decisions to build new infrastructure that increase the total costs spread among customers.”
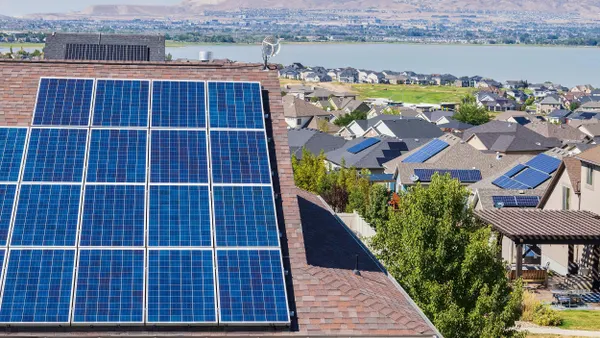
CATF noted that “decreases in demand, such as through net-metering of behind-the-meter resources or relocation of industry, often increase the per-unit costs, especially for fixed transmission and distribution infrastructure.”
While rate increases in the U.S. reached an average of 7% in 2025, “these national averages mask significant variation in state-level electricity rate impacts, with West Coast and Northeast states experiencing significant increases, and most of the rest of the country experiencing slower increases,” CATF said.
“New loads can exert downward rate pressure if they can better utilize existing transmission and distribution infrastructure, which can be aided by load flexibility,” CATF said. “Similarly, reductions in load can increase rates without adequate rate tariffs. The LBNL study found that states with behind-the-meter solar tariffs are correlated with higher rates, reflecting upward pressure caused by load reductions without proper cost allocation.”
The LBNL study noted that “revenues that utilities collect from individual customers never precisely match the total underlying costs of electricity supply,” and said that net-metered behind-the-meter solar “exacerbate this challenge.”
This is especially true when fixed costs are recovered through volumetric rates, the LBNL researchers said. When utilities collect less revenue from BTM solar than they planned to collect, which can lead to higher retail prices.
The LBNL study found that from 2019 to 2024, the growth of net-metered BTM solar “substantially reduced net electricity load in some states — by over 5% in California, Maine and Rhode Island, and by more than 2% in another seven states.”
Participating customers saw “direct bill savings,” the LBNL study said, but “given the disconnect between rate structures and cost structures under many net metering programs, and the financial cost of policy support, our regression results indicate that these load reductions were associated with increased retail prices for the broader customer base.”
CATF recommended that states and utilities try to ease rate increases with policies such as co-location and large load tariffs, demand response reform, transmission planning reform and the commercialization of new technologies like next-generation geothermal.